If you’ve tried searching, you’ve likely discovered that it’s not easy to find rates on reverse mortgages. For traditional home loans, it’s quite easy – you can turn to sources such as your local newspapers, well known surveys like Freddie Mac’s, and big financial websites such as Yahoo Finance. Why are reverse mortgages so much less transparent, and what can be done about it? Where are the best rates? Let’s break down the important factors and attempt to answer these questions.
The main topics covered in this guide are:
How Much does a Reverse Mortgage Cost?
As with any other loan, the interest on a reverse loan is only part of how much it will cost you. There are also closing costs that you must pay; since the Federal Housing Authority’s (FHA) Home Equity Conversion Mortgage (HECM) product dominates the market, we’ll focus our attention here.
The relevant reverse mortgage fees for a HECM loan are:
Insurance Premiums
When you are taking out one of these loans, you will need to pay a mortgage insurance premium at closing and an annual MIP for the entire life of the loan. The MIP charge at closing is calculated on the lesser of the appraised value of the home or the HECM loan limit, which is currently $726,525. The rate used to vary, but in late 2017 it became 2% for all borrowers.
Though this is not an upfront cost, it’s important to note that you will also pay an insurance premium throughout the life of the loan. This charge used to be 1.25% of the balance, but in late 2017 it was reduced to 0.5%
Origination Fee
These fees vary from lender to lender, though they are capped by the FHA. For homes that are valued at $125,000 or less, the origination fee is capped at $2,500. For homes worth more than $125,000, the lender is allowed to charge 2% on the first $200,000 and 1% on the value of the home above $200,000, for a maximum of $6,000.
Again, there’s a lot of information to digest here, so let’s consider a reverse mortgage example or two.
1. Home Valued at $100,000
Since the home value is less than $125,000, the lender can charge any amount up to $2,500. The fee is not based on a percentage of the home’s value.
2. Home Valued at $175,000
Since the home is valued at more than $125,000 but less than $200,000, the lender is allowed to charge a maximum of 2% of the home’s value, which in this case is a maximum of $3,500.
3. Home Valued at $250,000
Since the home is valued at greater than $200,000, the calculation here is a bit more complicated. For the first $200,000, the lender may charge up to 2%. For the remaining $50,000, the lender may charge a maximum of 1%. Here’s how this works out:
$200,000 * 2% = $4000
$50,000 * 1% = $500
The fee is therefore capped at $4,500.
Not all lenders charge the maximum fee possible. There are even some instances where you’ll be offered a rebate. The only way to find the lowest fees is to compare multiple offers, and unfortunately most consumers don’t comparison shop.
Servicing Fee
All home loans require servicing, and HECMs are no different. Servicing refers to the maintenance activities required throughout the life of the loan, including billing and making sure the borrower remains current on payments. With a HECM, servicing includes sending statements about the loan balance, making sure you are paid the proceeds of the loan, and checking that you are meeting tax and insurance requirements.
If there’s a servicing fee, it’s typically between $25-$35. If the loan has an interest rate that adjusts every year, the fee may be no greater than $30. If the rate adjusts every month, the cap is set at $35. The servicing fee for the first month is taken out at closing, and you continue to pay it during the life of the loan. These days servicing fees are much less common.
Other Fees
There are other fees, sometimes called third party fees, that you may need to pay as well. These include appraisal and survey fees, title and title insurance fees, and credit checks. As a general rule of thumb, expect these to cost $1,000 to $2,000.
Reverse Mortgage Interest Rates
So far, we’ve shown you many numbers but no rates, and there’s a reason for this – they’re difficult to find! Fortunately, the U.S. Department of Housing and Urban Development publishes statistics on all HECM originations each month. In this section you’ll find:
We don’t know what rates will be available to you, but you should be able to get an idea of what’s available by looking at some of the more recent averages.
Note – HUD publishes the data with a two month delay, so the most recent data available are always from 2-3 months ago.
Current Rates
| Date | Fixed Rate | Adjustable Rate |
| 2024-02-01 | 7.23% | 7.29% |
| 2024-03-01 | 5.53% | 7.26% |
| 2024-04-01 | 7.12% | 7.31% |
| 2024-05-01 | 7.68% | 7.41% |
| 2024-06-01 | 7.43% | 7.44% |
| 2024-07-01 | 7.72% | 7.41% |
| 2024-08-01 | 7.80% | 7.24% |
| 2024-09-01 | 7.90% | 6.82% |
| 2024-10-01 | 7.60% | 6.46% |
| 2024-11-01 | 4.09% | 6.38% |
| 2024-12-01 | 5.78% | 6.50% |
| 2025-01-01 | 5.65% | 6.49% |
| 2025-02-01 | 5.55% | 6.43% |
Historical Rates
2016
| Month | Fixed Rate | Adjustable Rate |
|---|---|---|
| 2016-01-01 | 4.93 | 3.54 |
| 2016-02-01 | 4.9 | 3.68 |
| 2016-03-01 | 4.94 | 3.81 |
| 2016-04-01 | 4.96 | 3.93 |
| 2016-05-01 | 4.95 | 4.03 |
| 2016-06-01 | 4.94 | 4.1 |
| 2016-07-01 | 4.92 | 4.16 |
| 2016-08-01 | 4.91 | 4.26 |
| 2016-09-01 | 4.92 | 4.44 |
| 2016-10-01 | 4.89 | 4.54 |
| 2016-11-01 | 4.91 | 4.6 |
| 2016-12-01 | 4.89 | 4.68 |
2017
| Month | Fixed Rate | Adjustable Rate |
|---|---|---|
| 2017-01-01 | 4.91 | 4.72 |
| 2017-02-01 | 4.91 | 4.68 |
| 2017-03-01 | 4.95 | 4.58 |
| 2017-04-01 | 4.96 | 4.5 |
| 2017-05-01 | 4.97 | 4.45 |
| 2017-06-01 | 4.99 | 4.4 |
| 2017-07-01 | 4.98 | 4.42 |
| 2017-08-01 | 4.98 | 4.48 |
| 2017-09-01 | 4.98 | 4.48 |
| 2017-10-01 | 4.95 | 4.49 |
| 2017-11-01 | 4.97 | 4.57 |
| 2017-12-01 | 4.95 | 4.63 |
2018
| month | fixed rate | adjustable rate |
|---|---|---|
| 2018-01-01 | 4.90 | 4.65 |
| 2018-02-01 | 4.84 | 4.66 |
| 2018-03-01 | 4.76 | 4.65 |
| 2018-04-01 | 4.72 | 4.76 |
| 2018-05-01 | 4.66 | 4.83 |
| 2018-06-01 | 4.65 | 4.79 |
| 2018-07-01 | 4.64 | 4.79 |
| 2018-08-01 | 4.63 | 4.79 |
| 2018-09-01 | 4.65 | 4.80 |
| 2018-10-01 | 4.64 | 4.84 |
| 2018-11-01 | 4.68 | 4.91 |
| 2018-12-01 | 4.69 | 5.03 |
2019
| month | fixed rate | adjustable rate |
|---|---|---|
| 2019-01-01 | 4.75 | 5.10 |
| 2019-02-01 | 4.77 | 5.06 |
| 2019-03-01 | 4.78 | 4.92 |
| 2019-04-01 | 4.77 | 4.83 |
| 2019-05-01 | 4.75 | 4.73 |
| 2019-06-01 | 4.74 | 4.69 |
| 2019-07-01 | 4.67 | 4.45 |
| 2019-08-01 | 4.73 | 4.23 |
| 2019-09-01 | 4.65 | 4.18 |
| 2019-10-01 | 4.54 | 4.23 |
| 2019-11-01 | 4.46 | 4.16 |
| 2019-12-01 | 4.27 | 4.07 |
2020
| month | fixed rate | adjustable rate |
|---|---|---|
| 2020-01-01 | 4.42 | 4.05 |
| 2020-02-01 | 4.32 | 3.99 |
| 2020-03-01 | 4.44 | 3.94 |
| 2020-04-01 | 4.24 | 3.63 |
| 2020-05-01 | 4.12 | 3.41 |
| 2020-06-01 | 3.68 | 3.20 |
| 2020-07-01 | 3.61 | 3.14 |
| 2020-08-01 | 3.54 | 3.03 |
| 2020-09-01 | 3.43 | 3.00 |
| 2020-10-01 | 3.39 | 2.94 |
| 2020-11-01 | 3.34 | 2.91 |
| 2020-12-01 | 3.27 | 2.82 |
2021
| month | fixed rate | adjustable rate |
|---|---|---|
| 2021-01-01 | 3.22 | 2.76 |
| 2021-02-01 | 3.26 | 2.69 |
| 2021-03-01 | 3.30 | 2.57 |
| 2021-04-01 | 3.29 | 2.48 |
| 2021-05-01 | 3.32 | 2.37 |
| 2021-06-01 | 3.37 | 2.25 |
| 2021-07-01 | 3.31 | 2.19 |
| 2021-08-01 | 3.36 | 2.20 |
| 2021-09-01 | 3.36 | 2.23 |
| 2021-10-01 | 3.34 | 2.19 |
| 2021-11-01 | 3.36 | 2.20 |
| 2021-12-01 | 3.36 | 2.27 |
2022
| month | fixed rate | adjustable rate |
|---|---|---|
| 2022-01-01 | 3.38 | 2.35 |
| 2022-02-01 | 3.44 | 2.46 |
| 2022-03-01 | 3.46 | 2.80 |
| 2022-04-01 | 3.56 | 3.16 |
| 2022-05-01 | 3.85 | 3.73 |
| 2022-06-01 | 4.35 | 4.03 |
| 2022-07-01 | 4.86 | 4.49 |
| 2022-08-01 | 5.24 | 5.07 |
| 2022-09-01 | 5.56 | 5.51 |
| 2022-10-01 | 5.57 | 5.95 |
| 2022-11-01 | 5.77 | 6.56 |
| 2022-12-01 | 6.39 | 6.91 |
2023
| month | fixed rate | adjustable rate |
|---|---|---|
| 2023-01-01 | 6.68 | 7.07 |
| 2023-02-01 | 6.62 | 7.08 |
| 2023-03-01 | 6.55 | 7.29 |
| 2023-04-01 | 6.72 | 7.04 |
| 2023-05-01 | 6.38 | 7.02 |
| 2023-06-01 | 6.35 | 7.24 |
| 2023-07-01 | 6.72 | 7.50 |
| 2023-08-01 | 7.07 | 7.68 |
| 2023-09-01 | 6.84 | 7.67 |
| 2023-10-01 | 6.65 | 7.73 |
| 2023-11-01 | 7.29 | 7.75 |
| 2023-12-01 | 7.76 | 7.69 |
2024
| month | fixed rate | adjustable rate |
|---|---|---|
| 2024-01-01 | 7.63 | 7.52 |
| 2024-02-01 | 7.23 | 7.29 |
| 2024-03-01 | 5.53 | 7.26 |
| 2024-04-01 | 7.12 | 7.31 |
| 2024-05-01 | 7.68 | 7.41 |
| 2024-06-01 | 7.43 | 7.44 |
| 2024-07-01 | 7.72 | 7.41 |
| 2024-08-01 | 7.80 | 7.24 |
| 2024-09-01 | 7.90 | 6.82 |
| 2024-10-01 | 7.60 | 6.46 |
| 2024-11-01 | 4.09 | 6.38 |
| 2024-12-01 | 5.78 | 6.50 |
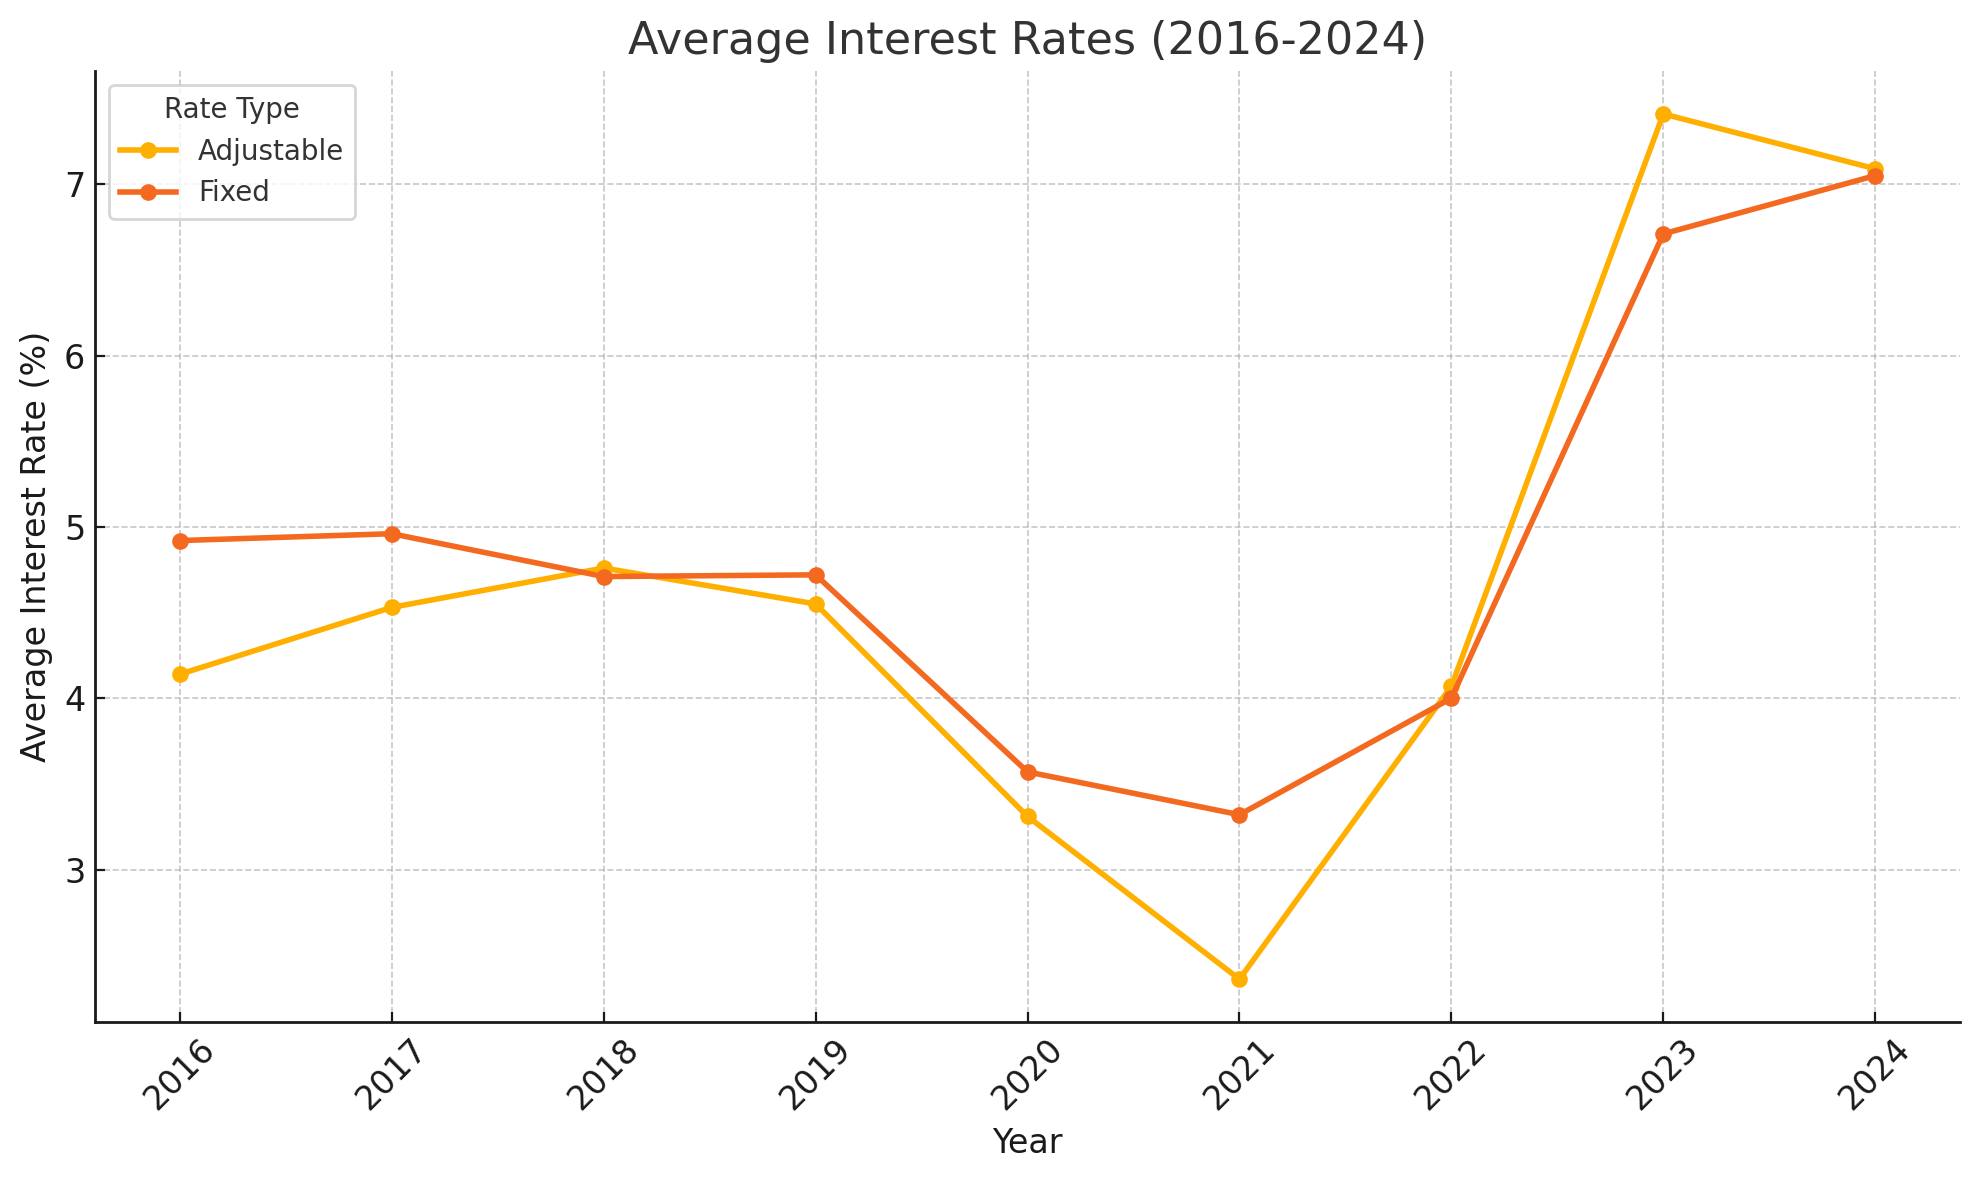
Historical Graph
We can also provide you with information about what determines the cost of interest and provide a few examples for how it could be calculated. First, rates vary based on the program you choose. Since the majority of loans are part of the HECM program, there is no need to worry much about the difference between government and private products, though in general the interest cost of a HECM should be lower since the loan is backed by the FHA.
Fixed vs Adjustable
The second important difference is between fixed and adjustable HECMs. Until 2007, all reverse mortgages were adjustable. According to a report released by the Consumer Financial Protection Bureau in 2012, 70% of loans are fixed rate. In 2013, the FHA made major changes to the HECM program and now less than 90% of reverse mortgage loans are adjustable. Adjustable loans may adjust on a monthly, semi-annual, or annual basis, but in practice almost all lenders offer monthly adjusting products.
An adjustable HECM is composed of an index and a margin, which is set by the lender. The margin never changes after the loan is originated, while the index fluctuates according to the market. Adjustable HECMs use either the Constant Maturity Treasury Index (1 Year or 1 Month) or the London Interbank Offered Rate (LIBOR, 1 month).
Annual Interest Rates
| Year | Fixed Rate | Adjustable Rate |
| 2014 | 4.99% | 2.66% |
| 2015 | 4.94% | 3.13% |
| 2016 | 4.92% | 4.14% |
| 2017 | 4.96% | 4.53% |
| 2018 | 4.71% | 4.76% |
| 2019 | 4.72% | 4.55% |
| 2020 | 3.57% | 3.31% |
| 2021 | 3.32% | 2.36% |
| 2022 | 4.00% | 4.07% |
| 2023 | 6.71% | 7.41% |
| 2024 | 7.05% | 7.09% |
| 2025 | 5.59% | 6.46% |
Calcuation Example
To help provide a bit more clarity, here are a few examples of how a reverse mortgage rate could be calculated. Please note that these are not real rates and we have not calculated APRs in order to avoid assumptions about closing costs. The rates below are referred to as “compounding rates”. The examples are provided solely for educational purposes.
Scenario 1: Fixed
Let’s say that a lender is offering you a fixed rate reverse mortgage at a rate of 4.2%. We also know that annual MIP will equal 0.5% of the loan balance. In this case, you would calculate the rate by adding the two together:
4.20% + 0.5% = 4.70%
To get the APR, the lender would need to disclose insurance and closing costs.
Scenario 2: Adjustable
Let’s say that the lender is offering you a loan that adjusts monthly based on the 1-month LIBOR rate with a 2.15% margin. Imagine that LIBOR is current at 0.2%, and you will need to pay 0.5% annual MIP. You would calculate the rate by adding these components together:
0.2% + 2.15% + 0.5% = 2.85%
Again, to get the APR, you must know insurance and closing costs.
Final Thoughts
Why aren’t these interest rates more readily available? Our best guess is that this is largely a function of the negative stigma that HECM loans still have among the public. The lenders are perhaps so focused on overcoming this obstacle that little attention is paid to facilitating comparison shopping. We hope this trend shifts over time.
Hopefully, you leave this guide with a better understanding of how much a reverse mortgage might cost you, both in terms of up front fees and the ongoing interest you will pay. As you’ve likely picked up on by now, these costs can be substantial. If, however, you’ve compared your options and determined that a HECM is the right option for you, we recommend that you shop around and try to get quotes from multiple lenders.
Click here to get free information about a reverse mortgage.
More Resources
US Department of Housing & Urban Development
Primary Mortgage Market Survey – Freddie Mac
About the Editor

Aaron Crowe is a freelance journalist who specializes in writing about personal finance. He has written for AOL, U.S. News & World Report, WiseBread, Bankrate, AARP, Allstate Insurance, Wells Fargo, newspapers, and various websites about credit, retirement, mortgages and related topics. You can find his work at AaronCrowe.net or on Twitter @AaronCrowe.